Map Catalog

Sunday, March 25, 2012

Bilateral Graph


http://www.voxeu.org/index.php?q=node/4997


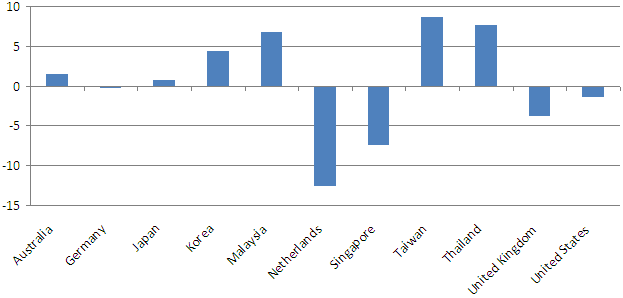
Bilateral Graphs are graphs that so positive and negative values within the data set. The map above shows bilateral trade balances with China (percent of GDP). Some balances are negative, like The United States and others are positive, like Japan.
Posted by Ruben Montane at 3:30 PM
Email ThisBlogThis!Share to XShare to FacebookShare to Pinterest

No comments:

Post a Comment

Newer Post Older Post Home
Subscribe to: Post Comments (Atom)

Blog Archive

  • ▼  2012 (50)
    • ►  April (5)
    • ▼  March (35)
      • Histogram
      • Parallel Coordinate Graph
      • Triangle Plot
      • Windrose
      • Climograph
      • Population Profile
      • Scatterplot
      • Nominal Area Choropleth Map
      • Accumulative Line Graph / Lorenz Curve
      • Bilateral Graph
      • Univariate Choropleth Maps
      • Proportional Circle Map
      • Unclassed Choropleth Maps
      • Range Graded Proportional Circle Map
      • Continuously Variable Proportional Circle Map
      • Classed Choropleth Map
      • DOQQ (Digital Orthophoto Quarter Quads)
      • DEM (Digital Elevation Model)
      • DLG (Digital Line Graph)
      • DRG (Digital Raster Graphic)
      • Black & White Aerial Photo
      • Bivariate Choropleth Map
      • Isopach
      • Isohyet
      • Isotach
      • Isobar
      • LIDAR
      • Doppler Radar
      • Infrared Aerial Photo
      • Cartographic Animations
      • Statistical Map
      • Cartogram
      • Flow
      • Isoline
      • Dot Distribution
    • ►  February (8)
    • ►  January (2)

About Me

Ruben Montane
View my complete profile
Travel theme. Powered by Blogger.