Map Catalog

Sunday, March 25, 2012

Scatterplot


http://rortybomb.wordpress.com/2011/04/11/housing-lock-is-not-a-major-component-of-this-crisis-plus-scatterplots-of-deleveraging/

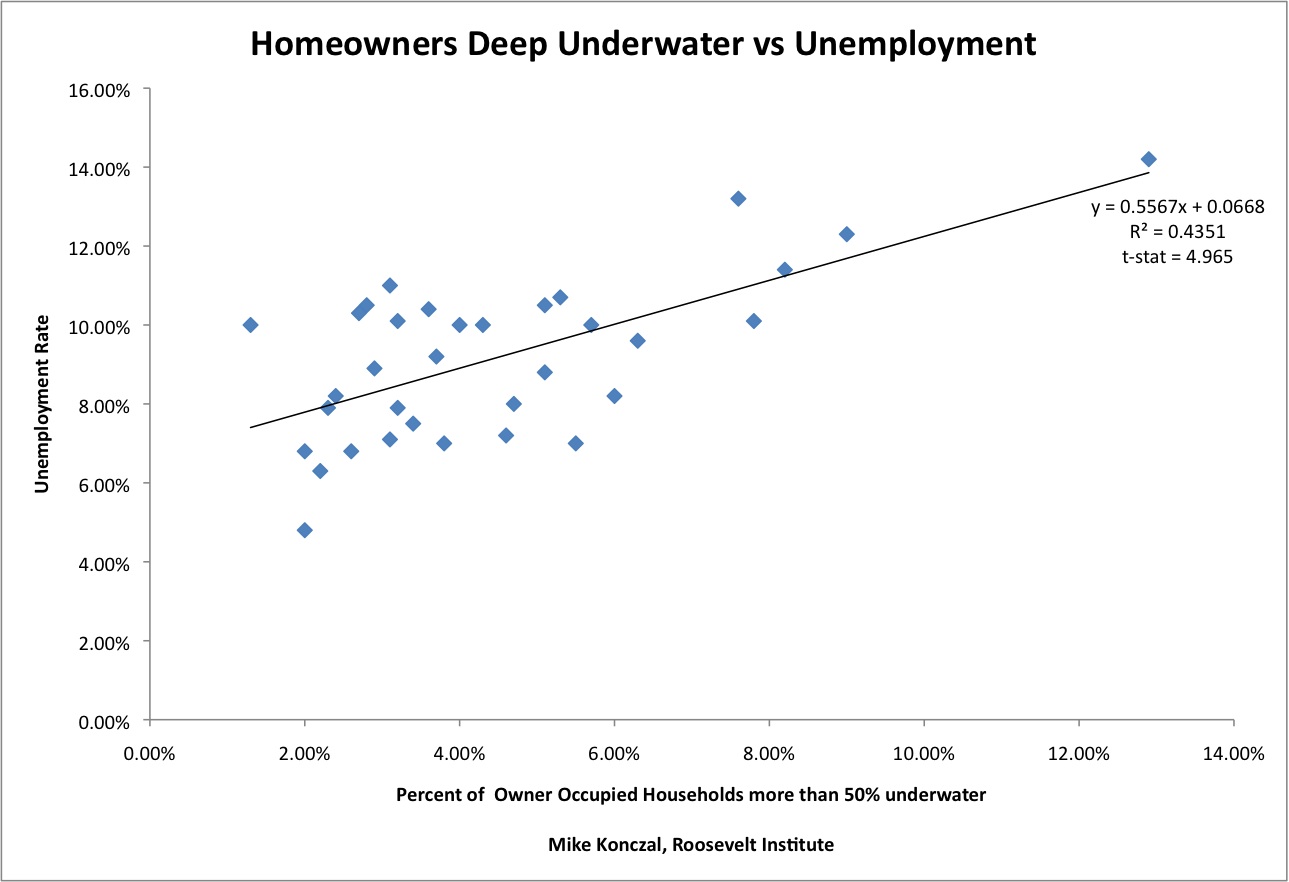
A scatterplot is a way to show a relationship between two variables. The map above represents the relationship between households more than 50% underwater and unemployment rate.
Posted by Ruben Montane at 6:49 PM
Email ThisBlogThis!Share to XShare to FacebookShare to Pinterest

No comments:

Post a Comment

Newer Post Older Post Home
Subscribe to: Post Comments (Atom)

Blog Archive

  • ▼  2012 (50)
    • ►  April (5)
    • ▼  March (35)
      • Histogram
      • Parallel Coordinate Graph
      • Triangle Plot
      • Windrose
      • Climograph
      • Population Profile
      • Scatterplot
      • Nominal Area Choropleth Map
      • Accumulative Line Graph / Lorenz Curve
      • Bilateral Graph
      • Univariate Choropleth Maps
      • Proportional Circle Map
      • Unclassed Choropleth Maps
      • Range Graded Proportional Circle Map
      • Continuously Variable Proportional Circle Map
      • Classed Choropleth Map
      • DOQQ (Digital Orthophoto Quarter Quads)
      • DEM (Digital Elevation Model)
      • DLG (Digital Line Graph)
      • DRG (Digital Raster Graphic)
      • Black & White Aerial Photo
      • Bivariate Choropleth Map
      • Isopach
      • Isohyet
      • Isotach
      • Isobar
      • LIDAR
      • Doppler Radar
      • Infrared Aerial Photo
      • Cartographic Animations
      • Statistical Map
      • Cartogram
      • Flow
      • Isoline
      • Dot Distribution
    • ►  February (8)
    • ►  January (2)

About Me

Ruben Montane
View my complete profile
Travel theme. Powered by Blogger.